Making Sense of the World Through Maps

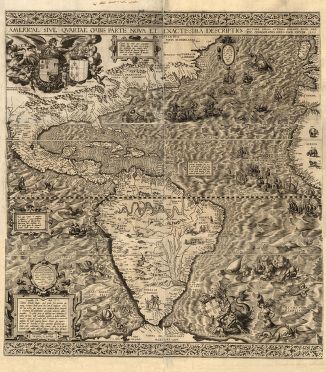
In 1562 Diego Gutiérrez, a Spanish cartographer, and Hieronymus Cock, a noted engraver from Antwerp, collaborated in the preparation of a spectacular and ornate map of what was then referred to as the fourth part of the world, America. It was the largest engraved map of America to that time.
Maps help us make sense of our world.
A sampling of the Library of Congress Geography and Map Division’s 4.5 million treasures has been digitized and is available in Map Collections: 1500 - 2003.
Introducing students to these primary sources through activities using historical maps from the American Memory collections is an excellent classroom activity. (A Primary Source Analysis Tool for analysis and note taking is available.)
What can be learned from historic maps? In addition to teaching geographic understanding, maps do an excellent job of illustrating change over time. They personalize history by giving evidence of familiar landmarks and of people, their beliefs, and the political policies of an era.
Most maps have a title, which often includes temporal information. Maps have orientation, which includes compass direction and geographic relationships within an established area. Maps have a source, or author, which often gives insight about its intended purpose and reason for creation. Maps may have a legend explaining the symbols used and a scale showing how distance is represented. Many maps use grids to show lines of latitude and longitude.
Use the Teachers Guide to Analyzing Maps to find guiding questions and activity ideas.
http://www.loc.gov/teachers/classroommaterials/presentationsandactivities/presentations/maps/

Comments
No comments